
Page 207 - e-Book
P. 207
whether the plant species belongs to rare, threatened, and endangered categories included in
the IUCN Red Data Book. Few common plants available in the area were analysed for their
phytoremediation properties, so that planting such species could naturally unwind the
pollution after disasters.
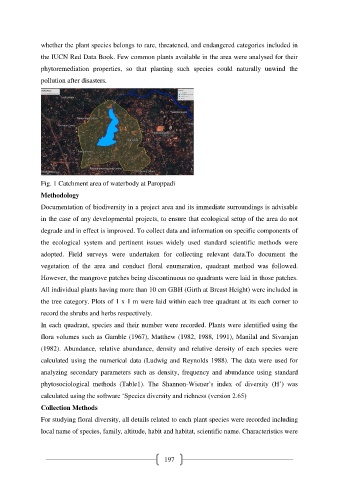
Fig. 1 Catchment area of waterbody at Paroppadi
Methodology
Documentation of biodiversity in a project area and its immediate surroundings is advisable
in the case of any developmental projects, to ensure that ecological setup of the area do not
degrade and in effect is improved. To collect data and information on specific components of
the ecological system and pertinent issues widely used standard scientific methods were
adopted. Field surveys were undertaken for collecting relevant data.To document the
vegetation of the area and conduct floral enumeration, quadrant method was followed.
However, the mangrove patches being discontinuous no quadrants were laid in those patches.
All individual plants having more than 10 cm GBH (Girth at Breast Height) were included in
the tree category. Plots of 1 x 1 m were laid within each tree quadrant at its each corner to
record the shrubs and herbs respectively.
In each quadrant, species and their number were recorded. Plants were identified using the
flora volumes such as Gamble (1967), Matthew (1982, 1988, 1991), Manilal and Sivarajan
(1982). Abundance, relative abundance, density and relative density of each species were
calculated using the numerical data (Ludwig and Reynolds 1988). The data were used for
analyzing secondary parameters such as density, frequency and abundance using standard
phytosociological methods (Table1). The Shannon-Wiener’s index of diversity (H’) was
calculated using the software ‘Species diversity and richness (version 2.65)
Collection Methods
For studying floral diversity, all details related to each plant species were recorded including
local name of species, family, altitude, habit and habitat, scientific name. Characteristics were
197