
Page 499 - e-Book
P. 499
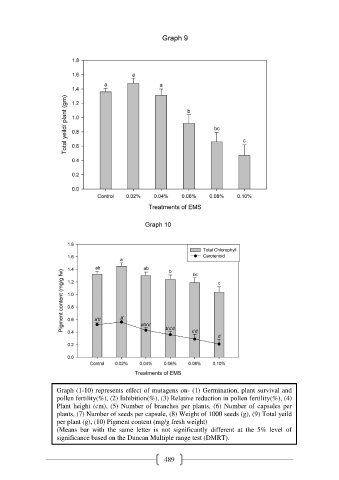
Graph (1-10) represents effect of mutagens on- (1) Germination, plant survival and
                     pollen fertility(%), (2) Inhibition(%), (3) Relative reduction in pollen fertility(%), (4)
                     Plant height (cm), (5) Number of branches per plants, (6) Number of capsules per
                     plants, (7) Number of seeds per capsule, (8) Weight of 1000 seeds (g), (9) Total yeild
                     per plant (g), (10) Pigment content (mg/g fresh weight)

                     (Means  bar  with  the  same  letter  is  not  significantly  different  at  the  5%  level  of
                     significance based on the Duncan Multiple range test (DMRT).


                                                           489