Page 526 - e-Book
P. 526

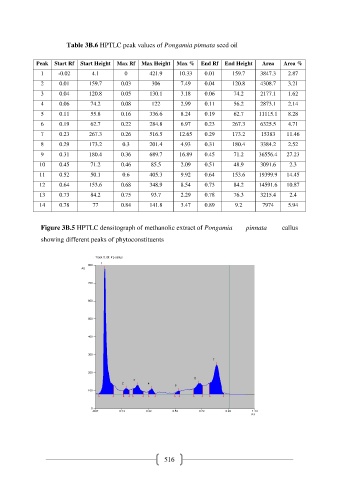
Table 3B.6 HPTLC peak values of Pongamia pinnata seed oil


              Peak  Start Rf  Start Height  Max Rf  Max Height  Max %  End Rf  End Height    Area    Area %
               1      -0.02      4.1         0        421.9     10.33    0.01      159.7    3847.3    2.87

               2      0.01      159.7       0.03      306       7.49     0.04      120.8    4308.7    3.21
               3      0.04      120.8       0.05      130.1     3.18     0.06      74.2     2177.1    1.62
               4      0.06       74.2       0.08      122       2.99     0.11      56.2     2873.1    2.14
               5      0.11       55.8       0.16      336.6     8.24     0.19      62.7     11115.1   8.28
               6      0.19       62.7       0.22      284.8     6.97     0.23      267.3    6325.5    4.71

               7      0.23      267.3       0.26      516.5     12.65    0.29      173.2     15383    11.46
               8      0.29      173.2       0.3       201.4     4.93     0.31      180.4    3384.2    2.52
               9      0.31      180.4       0.36      689.7     16.89    0.45      71.2     36556.4   27.23
               10     0.45       71.2       0.46      85.5      2.09     0.51      48.9     3091.6     2.3

               11     0.52       50.1       0.6       405.3     9.92     0.64      153.6    19399.9   14.45
               12     0.64      153.6       0.68      348.9     8.54     0.73      84.2     14591.6   10.87
               13     0.73       84.2       0.75      93.7      2.29     0.78      76.3     3215.4     2.4
               14     0.78        77        0.84      141.8     3.47     0.89       9.2      7974     5.94


               Figure 3B.5 HPTLC densitograph of methanolic extract of Pongamia        pinnata      callus

               showing different peaks of phytoconstituents


                                                           516
   521   522   523   524   525   526   527   528   529   530   531