Page 560 - e-Book
P. 560
Methodology

                       First of all, reconnaissance survey was conducted of the whole study area to identify
               the  gregarious  patches  of  grass  species  for  further  detailed  investigation  for  density

               assessment. Sites  so selected in  road sites, former land,  forest  land, near River and Pond,
               waste land, TFRI and SFRI campus.

                       After identification of the study sites square shaped quadrats of size 1m x 1m were
               randomly  laid  out  in  the  field  for  detailed  observations  on  growth  and  phyto-sociological

               parameters. A total 25 such quadrats have been laid out in various study sites. Coordinates of

               the  quadrats  have  been  recorded  with  the  help  of  G.P.S.,  Soil  type  of  the  quadrats  also
               recorded. Grass species standing in the quadrats have been identified in the field by the field

               expert.

                       Wherever needed, the help of the Flora of Madhya Pradesh (Roy  et al., 1992) was
               also taken for identification. Grass specimens were also collected and their identification was

               verified with the standard specimens kept in the herbarium of State Forest Research Institute,
               Jabalpur (MP).

                       The data collected was analyzed for various phyto-sociological parameters, such as
               density, frequency, abundance and IVI (Importance Value Index), using standard method as

               per Mishra (1968).

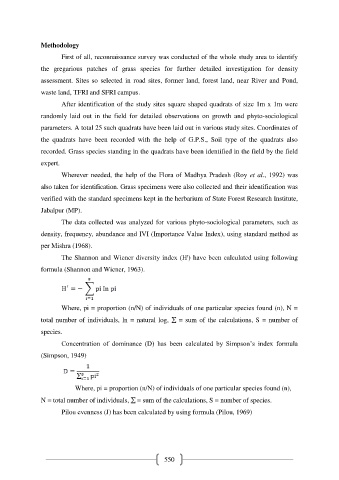
                       The Shannon and Wiener diversity index (Hꞌ) have been calculated using following
               formula (Shannon and Wiener, 1963).


                       Where, pi = proportion (n/N) of individuals of one particular species found (n), N =
               total number of individuals, ln = natural log,   = sum of the calculations, S = number of

               species.
                       Concentration  of  dominance  (D)  has  been  calculated  by  Simpson’s  index  formula

               (Simpson, 1949)


                               Where, pi = proportion (n/N) of individuals of one particular species found (n),

               N = total number of individuals,   = sum of the calculations, S = number of species.

                       Pilou evenness (J) has been calculated by using formula (Pilou, 1969)


                                                           550

